Yardi Rent Roll Visualization
Industry: Commercial Real Estate
Company Profile: Developer and manager of over 25 million SF of office, retail and industrial space. Using Yardi.
Business Challenge: The CRE leader approached us for a better way of analyzing their Yardi rent roll.
- Some of the challenges described were:
• Too much reliance on exporting Yardi reports to Excel and manually creating summaries. - Too much reliance on exporting Yardi reports to Excel and manually creating summaries.
- Too many linked Excel files.
- Changes were difficult propagate.
- “What if” analysis was difficult
- Grouping and consolidating building data was difficult
- Data was not “visual”
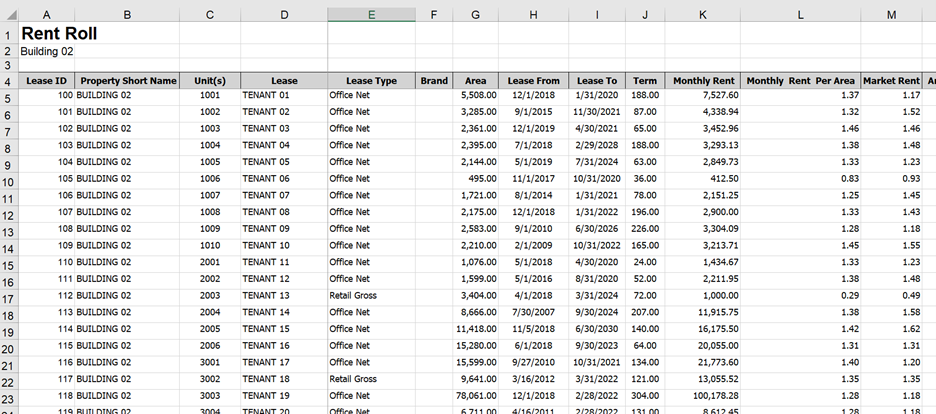
The Yardi Rent Roll exported from Yardi looks like this:
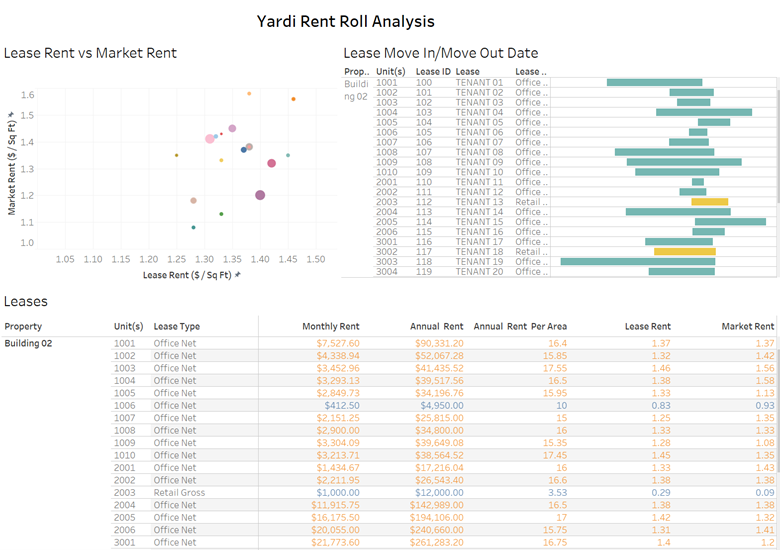
Solution: With very little effort, we converted the rent roll report into the interactive, analytical visualization shown below. Some manual processing of the Excel files was required.
Benefits: Being able to visually analyze the Yardi rent roll for all buildings has many benefits:
- Ability to see trends, gaps
- Ability to consolidate data from multiple buildings
- Ability to filter by Lease Type, Lease
- Ending Date, Square Footage and more
- Overall, better decision-making capability
How to visualize Yardi data
Visit the RentViewer site to learn more about Yardi data visualization and analytics. Order a Yardi dashboard.