Tableau Consulting
Metric-X has been a Tableau Partner since 2013. We build powerful, visually stunning analytics solutions for your business.
Your Tableau Partner Since 2013
Metric-X has been an authorized Tableau Partner since 2013. We help small and midsize companies build powerful, visually stunning analytics solutions that transform raw data into actionable business insights.
Whether you're new to Tableau, considering it for your organization, or need expert consulting help — we've got answers to your questions below.
Technical Architecture
Here's how a typical Metric-X analytics solution works. We connect your data sources, build a central reporting database, and push insights to Tableau for interactive visualization.

The Tableau Product Ecosystem
Tableau is a family of products that work together. Understanding which components you need is key to a successful implementation.
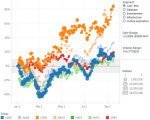
Tableau Desktop
The authoring tool where analysts build reports, dashboards, and data visualizations. Connect to your data, drag-and-drop to create interactive charts.
Tableau Server / Online
Publish and share dashboards securely. Server runs on your infrastructure; Online is Tableau's hosted cloud platform. Both enable browser-based viewing.
Tableau Prep
Visual ETL tool for data transformation. Clean, combine, and shape data from multiple sources before analysis — no coding required.

Business Value
Faster decisions, self-service analytics, reduced reliance on IT. Tableau's ROI comes from empowering teams to answer their own data questions.
Metric-X is an authorized Tableau Partner since 2013. We sell licenses, build solutions, and provide ongoing support.
Never Heard of Tableau
What is Tableau?
Where can I see a demo?
What are some things that Excel can do that Tableau cannot?
What are some things that Tableau can do that Excel cannot?
Is Tableau the name of the company or the name of the software?
What are the negatives of Tableau?
We do all our data analysis in Excel. Why would we want Tableau?
Considering Tableau
We create reports in Excel. Why would I need Tableau?
What skills are necessary to use Tableau?
I am already an Excel power user. How long will it take me to learn Tableau?
What kind of work has Metric-X done with Tableau?
Can I do a free evaluation of Tableau?
How is Tableau different from Power BI?
Which do you recommend, Power BI or Tableau?
What do you mean by Total Cost of Ownership?
Is Tableau one software or several?
Need Tableau Help
I need an experienced Tableau consultant, how can Metric-X help?
What does it mean to be a Tableau Partner?
Buying licenses from Metric-X or from Tableau, what's the difference?
We already own Tableau. We need someone to organize our data for analysis. Can Metric-X help?
Official Partner
Ready to speak with us?
Contact Saad Shah, founder of Metric-X. Whether you're just exploring or ready to start a project, we're here to help.

Ready to Transform Your Data into Decisions?
Let Metric-X build your Tableau analytics solution. Trusted partner since 2013.
Book a Free Consultation