Power BI Consulting
Metric-X is a Microsoft Partner offering Power BI report development and guidance for companies seeking data-driven insights.
Microsoft Partner for Power BI
Metric-X is a Microsoft Partner offering Power BI report development and guidance for companies seeking data-driven insights. We help you leverage the full Microsoft ecosystem — from Excel to Azure to Power BI.
Explore our frequently asked questions below to learn more about Power BI and how Metric-X can help your organization.
Technical Architecture
Metric-X builds end-to-end analytics solutions. We connect your business systems, centralize the data, and deliver interactive Power BI dashboards your team can access from any device.

The Power BI Ecosystem
Power BI is part of the Microsoft ecosystem. Here's how the components work together to deliver enterprise analytics.
Power BI Desktop
Free authoring tool. Build data models, create DAX measures, design interactive reports. Connects to 100+ data sources.
Power BI Service
Cloud platform (app.powerbi.com) for publishing, sharing, and collaborating on reports. Integrates with Teams, SharePoint, and Office 365.
Power BI Gateway
Bridge between on-premises data and the cloud. Enables scheduled refresh so dashboards always show the latest numbers.
Power BI Mobile
Native iOS and Android app. Access dashboards on the go with touch-optimized layouts and push notifications for data alerts.
Sample Dashboard
Here's an example of a Power BI occupancy dashboard built by Metric-X for property management analytics.
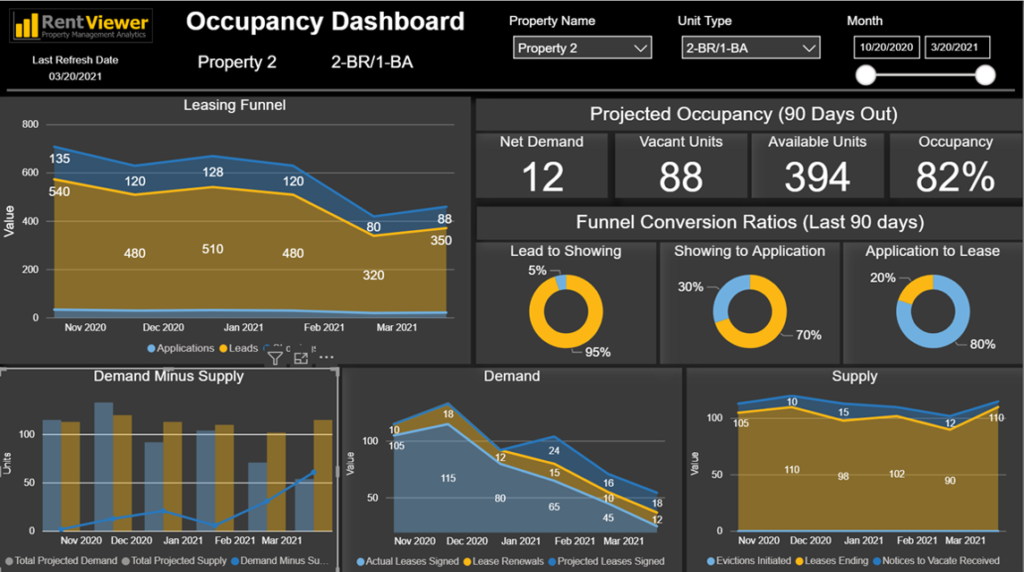
Occupancy Dashboard — Leasing funnel, projected occupancy, demand vs. supply analysis
Never Heard of Power BI
What is Power BI?
Can Power BI and Excel co-exist?
What are some things that Power BI can do that Excel cannot?
What is Power BI Desktop and the Power BI Service?
Considering Power BI
We create reports in Excel. Why would I need Power BI?
What skills are necessary to use Power BI?
I am already an Excel power user. How long will it take me to learn Power BI?
How is Power BI different from Tableau?
Which do you recommend, Power BI or Tableau?
What do you mean by Total Cost of Ownership?
What are the negatives of Power BI?
We do all our data analysis in Excel. Why would we want Power BI?
Need Power BI Help
I need an experienced Power BI consultant, how can Metric-X help?
We already own Power BI. We need someone to organize our data for analysis. Can Metric-X help?
Official Partner
Ready to speak with us?
Contact Saad Shah, founder of Metric-X. Whether you're just exploring or ready to start a project, we're here to help.

Ready to Unlock the Power of Your Data?
Let Metric-X guide your Power BI implementation from start to finish.
Book a Free Consultation