Video Demo
Here is the video demo of the Expense Analytics solution described in this blog post.
Julie’s Budgeting Story
“We need to cut operating expense by 5%. Julie will develop the new budget and present it at the next meeting,” said the CEO of a real estate company that manages a diverse multifamily and commercial portfolio.
As Julie Porter walked out of the executive meeting where she was tasked with finding ways to reduce operating expense, she thought about the next steps.
Business was growing. There were many high priority projects underway. And now Julie’s job was to create a budget so that more can be done by spending less money than last year. Sound familiar? Where to start?
Julie recently became the CFO at a real estate management company. Her company has 5,000 multifamily units, as well as 25 neighborhood shopping centers. She contacted us because she wanted her team to have the analytics capability to easily sift through expense transactions and find ways to create a lean but realistic budget.
Julie’s Strategy for Budgeting
Here’s the approach Julie decided to take: Base the budget on prior year actuals, with some caveats …
- Don’t trust the past P&L reports. Assess their accuracy before using past numbers to project the future.
- Separate the “normal, recurring” transactions from the one-off or unusual ones.
- Look at transactions as far back as 4 years, when business was growing and expenses grew even faster
- Avoid using Excel workbooks; use an analytics tool like Tableau that makes it easy to analyze expenses
Julie’s Task List for Creating the Budget
Below are the steps for getting to the first draft of the new budget.
- Compile last four years of expense transactions
- Look for errors in the data and fix them
- Analyze trends
- Look at the fastest growing categories
- Identify the discretionary vs mandatory expenses
- Look for one-time transactions that should not be projected into the future (such as a one-time expenses incurred due to a highly unexpected fire damage)
- Once the historical data has been cleaned and understood, create the first draft of the budget for the next 12 months
- Consult the regional managers and business unit leaders on the first draft
Real Estate Expense Analysis Platform
Our goal was to deliver a flexible, visual, interactive solution to enable Julie and her team to perform expense analysis.
Below are two views showing our solution for enabling real estate expense analysis from various perspectives. By selecting a GL Account in the upper left pane, the other panels will update to show the activity for the selected account in different ways. Watch the video for a demo.
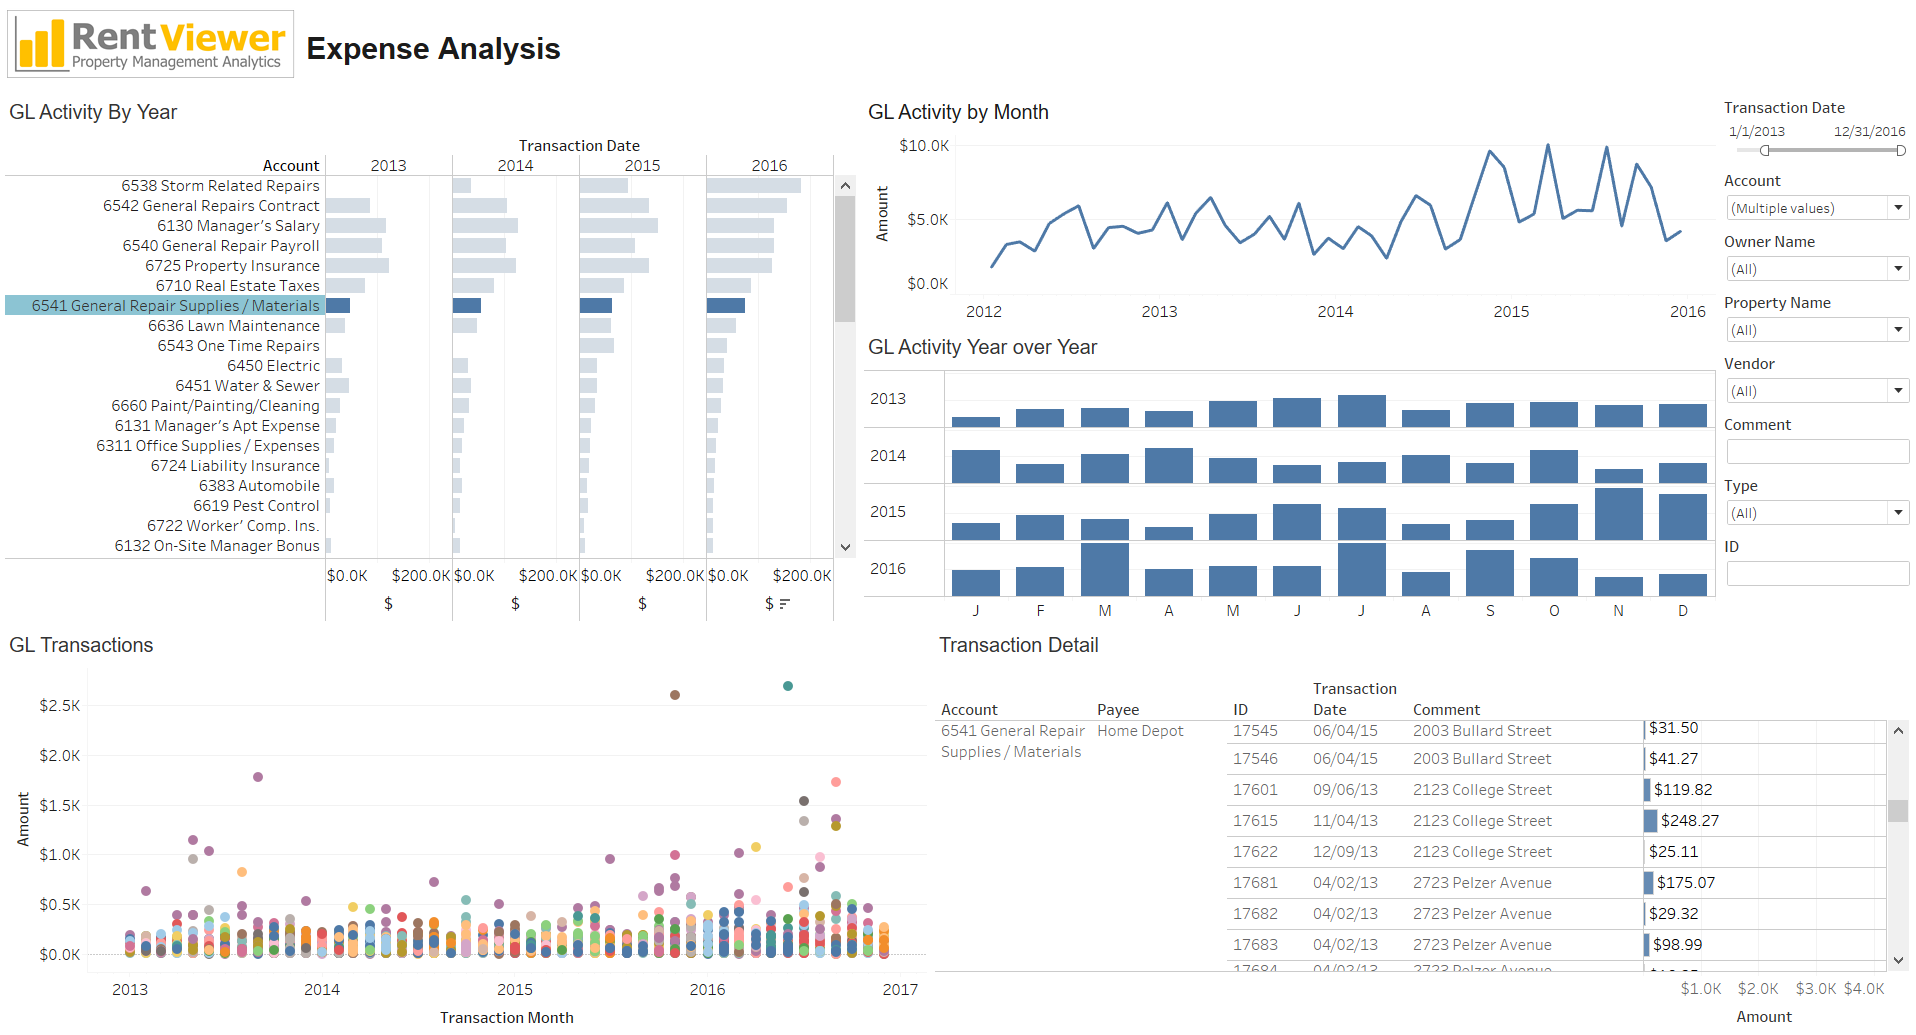
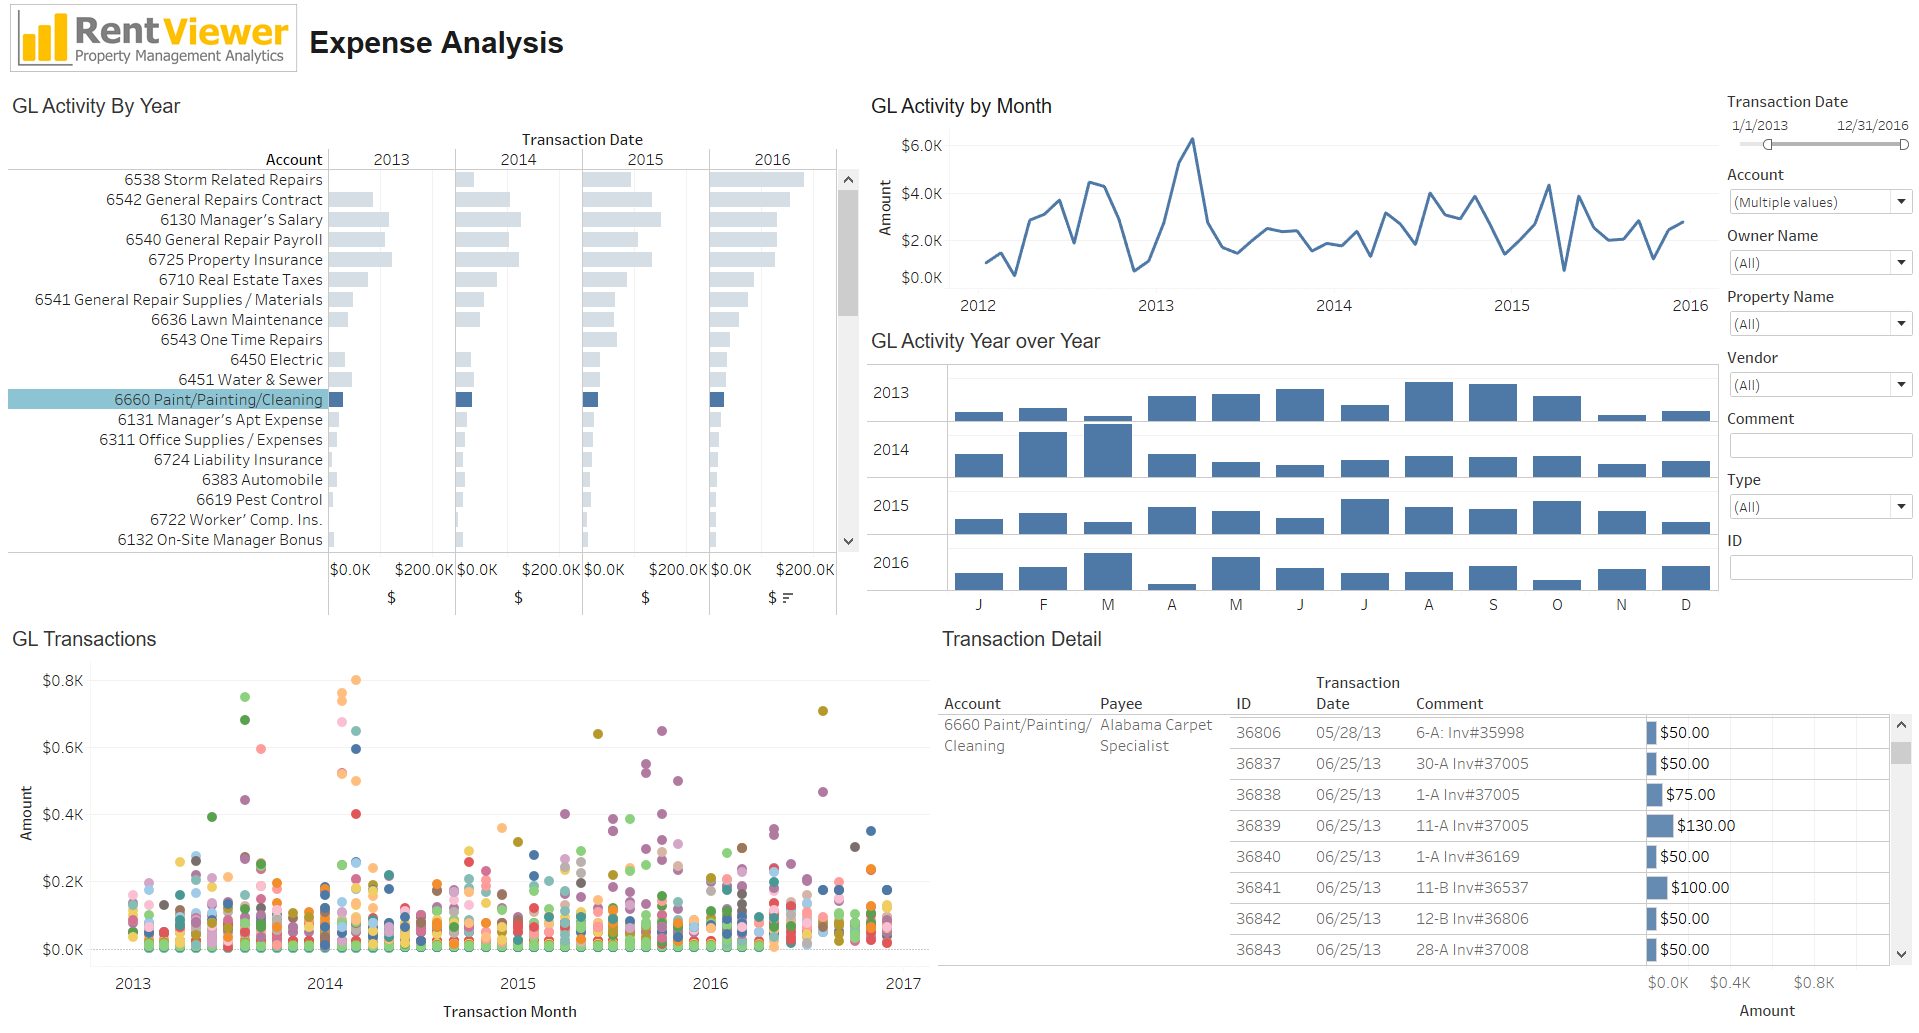
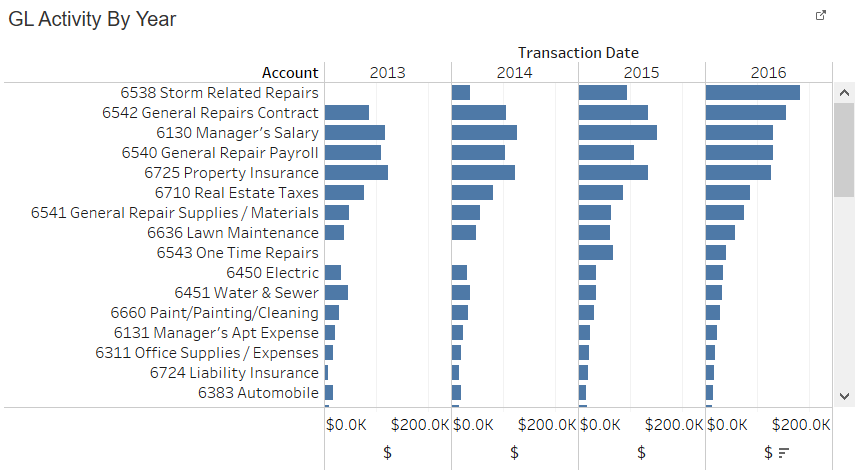
GL Activity by Year
This chart provides Julie a snapshot of the expense accounts with the most activity. Julie is able to sort the list from highest to lowest for any year. In this view, it looks like “6538 Storm Related Repairs” were the highest expense items in 2016, and has been growing the past three years.
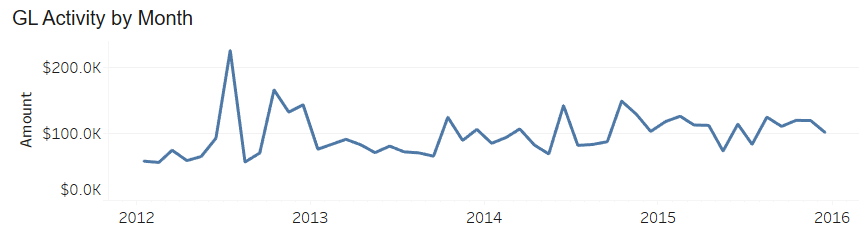
GL Activity by Month
This is a “sparkline” view of the total monthly activity in the selected GL Accounts. It is useful for identifying peaks and valleys as well as trends.
GL Activity Year over Year
This view stacks the months. This is useful for identifying seasonality (or the unexpected lack of).

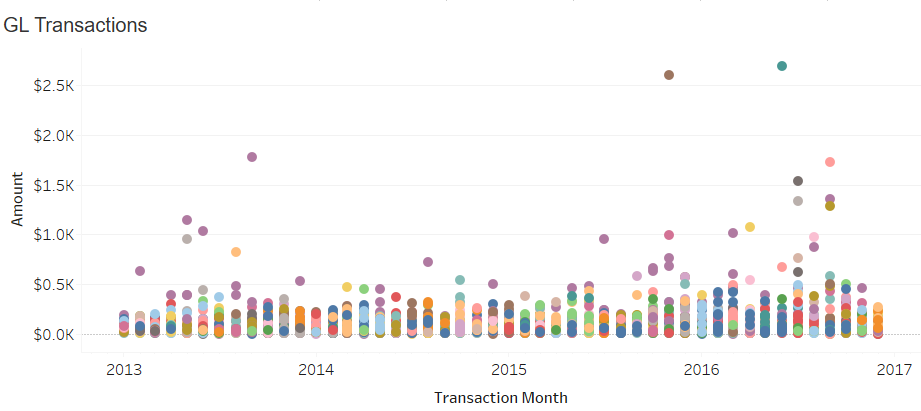
GL Transactions Scatterplot
Each dot in the scatterplot below is a General Ledger transaction. The outliers easily stand out.
Hovering over a dot reveals more information about the transaction. Selecting one or more dots will update another panel so that more detail can be displayed about them.
GL Transaction Detail
This is a simple table displaying an individual transaction per row. We provided the ability to search on the “Comment” field, so this panel is very useful. Displaying the Transaction ID and the Transaction Date helps identify the transactions that need to be corrected or included/excluded from budgeting considerations.
Conclusion
Being able to analyze the expense transaction from many different perspectives, and being able to filter by time period, property, GL Account was a tremendous time saver for Julie and her team. Excel was used only for compiling the transactions that needed to be revisited in the accounting system. Not only was the RentViewer platform useful for analyzing expenses, it was also very powerful for making the recommendations to the Regional Managers and Business Unit Leaders. The new budget highlights were illustrated in compact, visual views that were informative and compelling. Asked about RentViewer, Julie said “RentViewer gave us the ability to analyze our expenses in such a flexible, customizable way that would not have been possible with Excel or with the canned reports from our real estate software.”
We created a questionnaire to help you cut through the mass of data to your “low hanging fruit” and start reducing the operating expenses in your business rapidly!
Metric-X specializes in data analytics for small and mid-sized businesses. View our case studies | Tableau consulting | Power BI consulting | Contact us