How to nurture and retain your best tenants
Most property management CEO’s and CFO’s allocate budget for tenant retention because the number of months (and years) a tenant stays with you is one of the main drivers of profitability…
but “gut feel” or “instinct” are not reliable methods to choose where you allocate your budget for maximum results and it’s much more effective to make data-driven decisions on client retention,
So, we often build tenant retention models to help you answer these questions…
- Why are tenants leaving us?
- Which tenants are likely to leave us?
- How do we assess the risk of losing the “good” tenants so that we can take action to mitigate the risk?
- How much budget do we need to allocate for tenant retention?
- How do we prioritize the money we spend for tenant retention to maximise the return (across properties and tenants)?
The first two questions are answered by surveying the surveys the tenants to get raw data.
Next, we perform “quadrant” analysis and score the tenants based on selected retention factors to give you clear information to make better decisions…
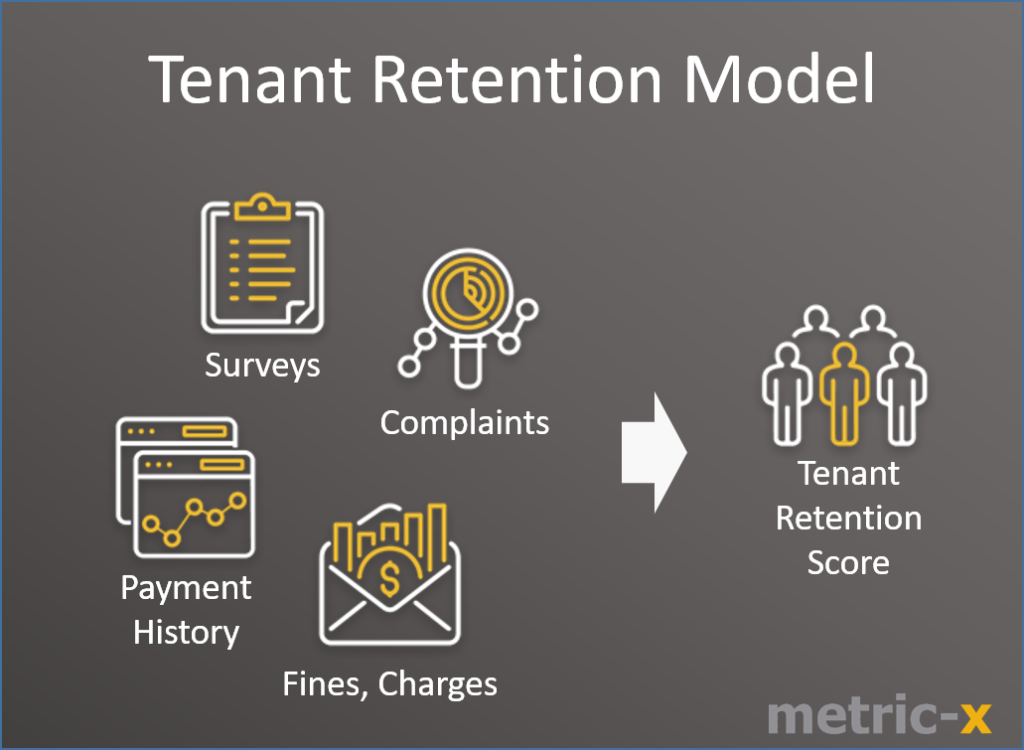
Tenant Retention Model Inputs / Outputs
The high-level inputs for our model are shown in the diagram below.
Quadrant Analysis
In this model, tenants fall into one of four quadrants. The ones that have the high Tenant Score and are Not Likely to Renew (Quadrant 1) are a concern. Also, in order to maintain the appropriate mix of Tenant Scores, we must also pay attention to those who have low Tenant Scores and are Likely to Renew (Quadrant 4).
| Not likely to Renew | Likely to Renew | |
|---|---|---|
| High Tenant Score | Quadrant 1 | Quadrant 2 |
| Low Tenant Score (or Eligibility for Eviction) |
Quadrant 3 | Quadrant 4 |
Tenant Retention Scoring Framework
We developed framework for scoring the tenants based on several factors as shown below.
Each factor has a weight in the overall model. And each has numeric scale ranging from 1 (unfavorable) to 5 (favorable).
| Retention Factor | Scoring Criteria | Weight | Data Source |
|---|---|---|---|
| Duration of Leases | 5: 4 Years or More | 5% | PMS |
| 1: Less than 1 Year | |||
| Survey Score – “Would You Recommend?” | 5: “Would Highly Recommend” | 5% | Survey Monkey |
| 1: “Would Not Recommend” | |||
| Survey Score – “How are we Doing?” | 5: Responded | 10% | Survey Monkey |
| 1: No Response | |||
| Survey Score – “Do you Plan to Renew?” | 5: “Yes, Definitely” | 5% | Survey Monkey |
| 1: “No” | |||
| Delinquency | 5: No Delinquent Balance | 5% | PMS |
| 1: Delinquent balance > $1,000 | |||
| Rent Relief Requested | 5: No Rent Relief Requested | 5% | PMS |
| 1: Currently on Rent Relief | |||
| Employment Stability | 5: Highly Stable | 10% | Misc. Notes – to be compiled |
| 1: Not Employed | |||
| Complaints from Tenants | 5: No Complaints Received | 10% | PMS |
| 1: Multiple Complaints Verified | |||
| Late Payments | 5: No Late Payments Ever | 5% | PMS |
| 1: Significant Late Payment History | |||
| Add-ons Purchased | 5: Multiple add-ons purchased | 5% | PMS |
| 1: No add-ons | |||
| Damage Charges and Fines | 5: No Damage Charges or Fines Assessed | 5% | PMS |
| 1: Damage Charges or Fines > $1,000 | |||
| Other Factors | 5% | To Be Determined | |
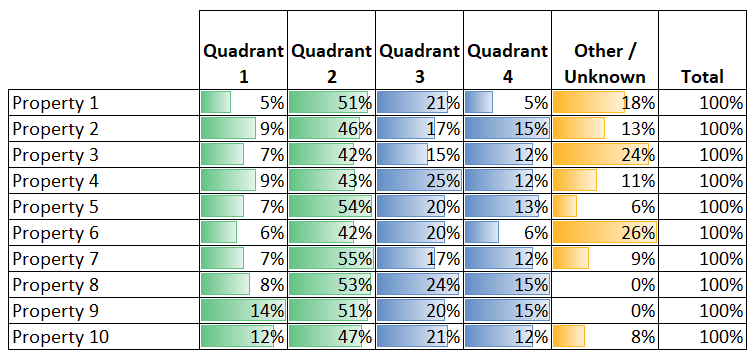
Retention Model Output
The table below shows the distribution of tenants across the 4 quadrants for selected properties. The “Other/Unknown” category is due to incomplete surveys or lack of data.
Conclusion
This analysis is very revealing about the current mix of tenants and the tenant sentiments.
We constructed this model to facilitate a holistic analysis of its tenants to enable better decisions to be made on budget allocation for tenant retention to maximize your returns.
Metric-X specializes in data analytics for small and mid-sized businesses. View our case studies | Tableau consulting | Power BI consulting | Contact us