Solutions for Business Performance Management
Inspired by the book Traction ®
Focus30
Focus30 is our suite of solutions used by property management executives for building high-performing teams, delighting their tenants and impressing their investors. This video explains the benefits and how your company can acquire the capabilities offered.
www.rentviewer.com
We have built a separate site for RentViewer. See demos, view our catalog, and learn more about monitoring your property management metrics at rentviewer.com
Visit RentViewer.com
Solutions for automating and accelerating each stage of the monthly performance management cycle
Metric-X provides a suite of tools to energize each stage of your business performance management cycle. This diagram shows the tools by phase. Browse the rest of the page for a description and links to further information.
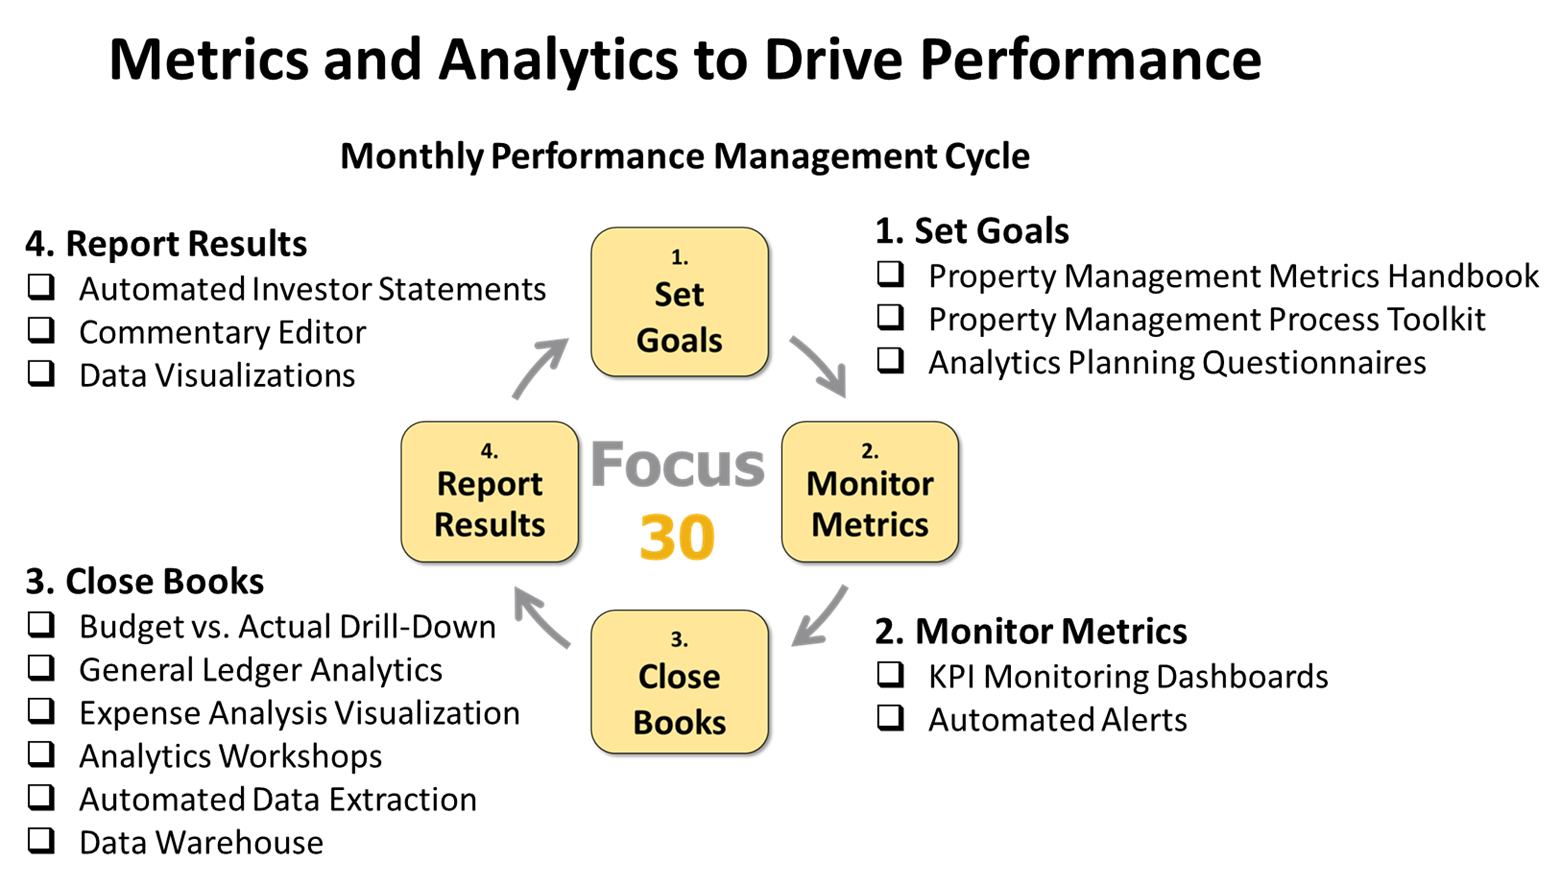
The tools displayed in the above diagram are described on the rest of this page.
1. Set Goals
Description
This phase in the performance cycle is about setting targets for the month and communicating them to your team. The goals are established after reviewing prior performance and agreeing on strengths and weaknesses, and prioritizing the areas that need the most attention.
Tools
The table below lists some of the tools available to supercharge this phase.
| Tool | Purpose | Description | |
|---|---|---|---|
| 1.1 | Property Management Metrics Handbook | To identify metrics that will be useful to monitor | The handbook lists over 100 metrics that can be used for measuring the effectiveness of property management activities. The metrics are organized by property management process. |
| 1.2 | Property Management Process Model |
To provide framework for how core functions are performed | The Property Management Process Model is a generic, simple framework for defining how work is performed in the company. It serves as a starting point for identifying constraints and weaknesses in the business processes. |
| 1.3 | Process Improvement Toolkit | To identify processes that need improvement | The Process Improvement Toolkit is a set of workbooks for teams to rate and rank processes, process defects and quantify the cost of process defects. |
| 1.4 | Analytics Planning Questionnaires |
To decide what topics to use analytics for | The questionnaires are based on topics such as Tenant Retention, Expense Analysis, Fraud Detection etc. Use the “planner” to prioritize the topics that will be of most value to your company. |
2. Monitor Metrics
Description
This is an on-going activity that involves comparing actuals against the plan. For example, how many showings have been completed month-to-date vs the plan? In most companies, compiling metrics is done manually, and therefore the plan vs. actual information is not readily available. Our solutions enable monitoring metrics as frequently as desired, from anywhere.
Tools
The table below lists the tools we provide for monitoring metrics. Dashboards can be developed for each role in the company (for example, Finance Dashboard, Maintenance Dashboard, Leasing Dashboard, Marketing Dashboard etc.)
| Tool | Purpose | Description | |
|---|---|---|---|
| 2.1 | Metrics Monitoring Dashboards | To display the month-to-date Plan vs. Actual data for selected metrics | The metrics monitoring dashboards display “Plan vs. Actual” data in visual charts that can be accessed from a PC, phone or even displayed on a large TV. On any given day, your team members can see where they stand with relative to the month-to-date targets for the metrics they are responsible for. |
| 2.2 | Automated Alerts | To send out emails or text messages when certain conditions are detected | Automated alerts are used to draw attention to red flags. For example, if your 90 Day A/R has exceeded $100K, an alert can be sent to you. Alerts are programs that regularly monitor your data for certain conditions. |
3. Close the Books
Description
In this context, “Close the Books” includes the Financial month-end close as well as compiling, reviewing the non-financial property management metrics.
The close activities include exporting transactions from the accounting system, reconciling account balances, identifying outliers and misclassified transactions
Tools
By creating a direct data connection to the accounting system and other systems, Metric-X can automate and accelerate many of the activities in this phase. The table below lists some of the tools available to supercharge this phase.
| Tool | Purpose | Description | |
|---|---|---|---|
| 3.1 | Budget vs. Actual (with drill-down) | To visually display variances in Budget vs Actual for selected GL accounts |
The Budget vs. Actual tool is an interactive report that visually displays variances in Actual vs. Budget by GL Account, by property for any given time period. This is a quick way to highlight where things did not go according to plan. This tool, used in conjunction with the KPI Dashboards described above can eliminate “over-budget” surprises month-to-month and improve chances of achieving the annual targets. |
| 3.2 | General Ledger Analytics | To easily find individual transactions in the General Ledger and identify outliers and unusual transactions. | The General Ledger Analytics tool is a set of interactive reports to visualize transactions. Multiple filters are provided (such as date range, GL Account, property, property group, vendor etc.) to remove the clutter. |
| 3.3 | Expense Analysis Visualization | To understand trends, seasonality and find opportunities for expense control | Expense Analysis tool is an interactive report that display expense transactions from multiple perspectives. This is a powerful tool to use when looking for opportunities to control expenses and make realistic budgets. |
| 3.4 | Automated Data Extraction | To extract data via the API of the Property Management System (and other systems) instead of exporting to Excel | By extracting data automatically from your key systems, we are able to compute actuals and compare them to the monthly target. Once the data has been extracted, it can also be used for analytics and also comes in handy for the month-end close. Data can be pulled from the system at frequencies such as hourly, daily, weekly and monthly. |
| 3.5 | Data Warehouse | To enable very flexible reporting of recent as well as historical data. | All large real estate management companies have invested in a data warehouse. Until recently, it was cost-prohibitive for mid-size and smaller companies to have their data warehouse. It is now easy to make a business case for having a data warehouse and using it to drive improvements across the entire company. |
4. Report Results
Description
Publishing the results at month-end is an opportunity to highlight what is going as planned and where there’s need for improvement. In addition to reporting the numbers, writing commentary on past performance and guidance on future performance forces the executive team to dig deeper into the operations of the business. Having candid discussions about the performance opens the door for setting realistic goals for the next 30 days, and close out the previous month.
Tools
We provide tools that help you tell the full story with data. The tools listed below not only enable reporting the current snapshot, but also the trend and future projections. By freeing up your team from manual, Excel-centric tasks, these tools enable your team to spend more time explaining the numbers and providing guidance on future performance.
| Tool | Purpose | Description | |
|---|---|---|---|
| 4.1 | Investor Statements | To automatically generate investor statements | Most investor statements are manually created in Excel. There are several downsides to this, including manual effort, lack of version control, having files scattered in multiple locations etc. Metric-X can pull data directly from the system or Excel files and produce presentation-quality statements that can be sent to investors or posted on an investor portal. |
| 4.2 | Commentary Editor | To record comments about monthly performance in a database instead of an Excel file | Using XLhub, an Excel add-in, commentaries about a specific metric, property, time period can be written in Excel. These comments can then be displayed on dashboards, on financial statements and on investor statements. Comments can be easily edited, and historical comments can be easily recalled. |
| 4.3 | Data Visualizations | To display trends, outliers and other characteristics about selected topics |
Data visualizations help explain what is going on in the business. Changes to strategy, plans and assumptions are usually based on uncovering new facts. Such facts can be uncovered by analyzing and visualizing large volumes of data. Data visualizations can be pre-built and also created on-demand. |
| 4.4 | Analytics Workshops | To answer a set of questions and validate assumptions by analyzing data | The Analytics Workshop is the simplest way to see results from analytics. It is a joint effort that combines your business knowledge with our data analysis expertise. The goal of the workshop is to answer a set of questions using data extracted from your systems The questions can be on any topic of your choice. |