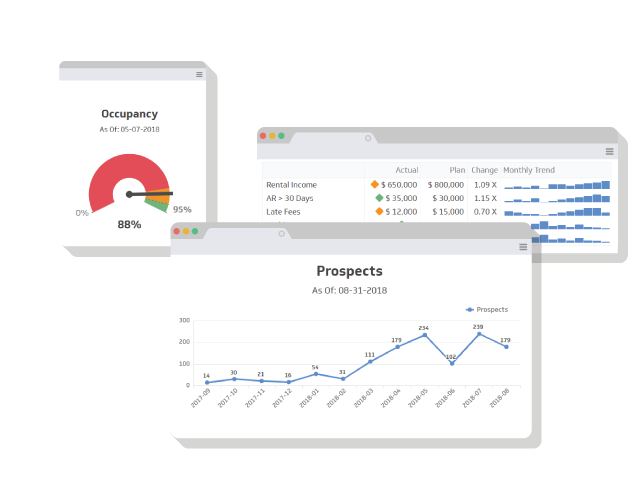
Build your own KPI dashboard by choosing from the components below
This page displays a variety of visual components for displaying your metrics. Decide which ones will be useful to you, and we can put them on your custom dashboard. Below each visual is a description as well as the name of the Rent Manager report it is sourced from.
Don’t see what you want? Let us know and we can build it for you.
The Offers on this page have been discontinued. Please see our catalog of pre-built modules at RentViewer.com
Visit RentViewer.com
Prospect
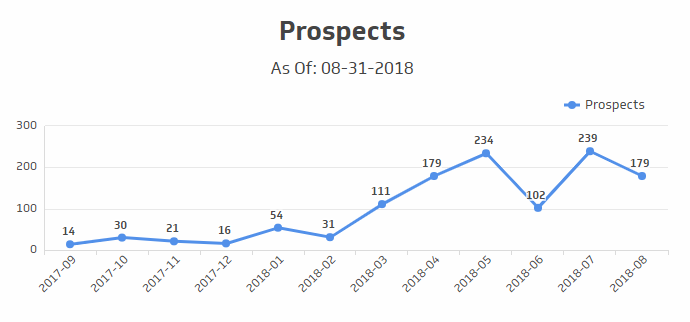
Description: Number of Prospects at end of each month
Source: 13 – Prospects List Report
Notes: Current month-to-date and previous 11 months
Dashboard Edition: Bronze, Silver or Custom
Component ID: LEAD-01
Source: 13 – Prospects List Report
Notes: Current month-to-date and previous 11 months
Dashboard Edition: Bronze, Silver or Custom
Component ID: LEAD-01
Applications
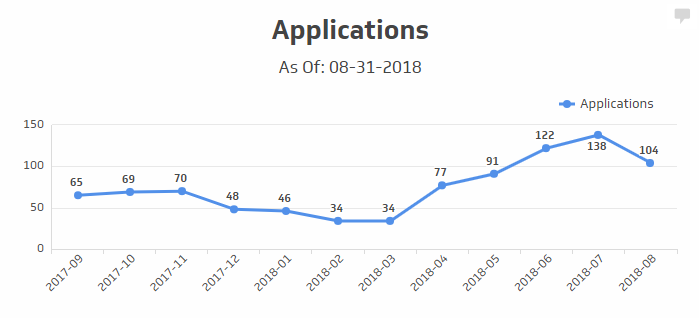
Description: Displays how many lease applications have been entered by month
Source: 21 – Box Score Report
Notes: – Current month + previous 11 months
– Line chart
Dashboard Edition: Bronze, Silver or Custom
Component ID: LEAD-02
Source: 21 – Box Score Report
Notes: – Current month + previous 11 months
– Line chart
Dashboard Edition: Bronze, Silver or Custom
Component ID: LEAD-02
Move In / Move Out Chart
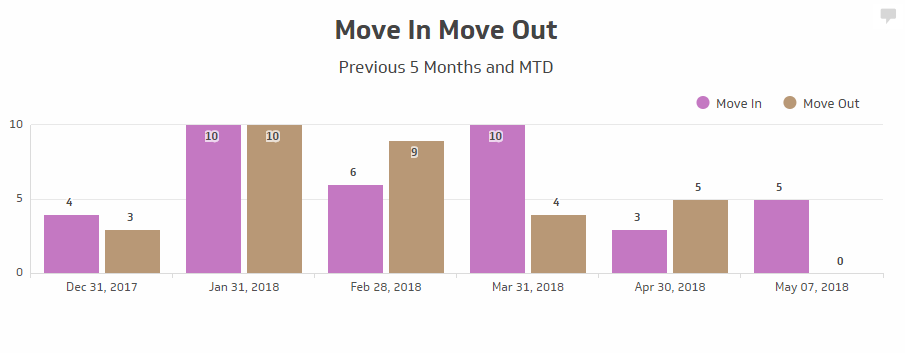
Description: Move In / Move Out counts displayed on same chart
Source: 77 – Move In Move Out Report
Notes:– Previous 5 Months and Month to Date
– Barchart
Dashboard Edition: Bronze, Silver or Custom
Component ID: LEAS-01
Source: 77 – Move In Move Out Report
Notes:– Previous 5 Months and Month to Date
– Barchart
Dashboard Edition: Bronze, Silver or Custom
Component ID: LEAS-01
Leasing Funnel
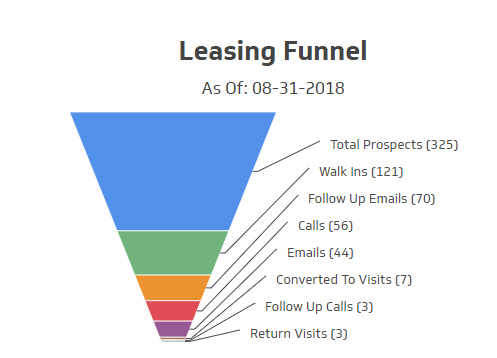
Description: Shows the numbers of prospects at each stage of the leasing funnel
Source: 21 – Box Score Report
Notes:
Dashboard Edition: Bronze, Silver or Custom
Component ID: LEAD-03
Source: 21 – Box Score Report
Notes:
Dashboard Edition: Bronze, Silver or Custom
Component ID: LEAD-03
Units Managed by Type
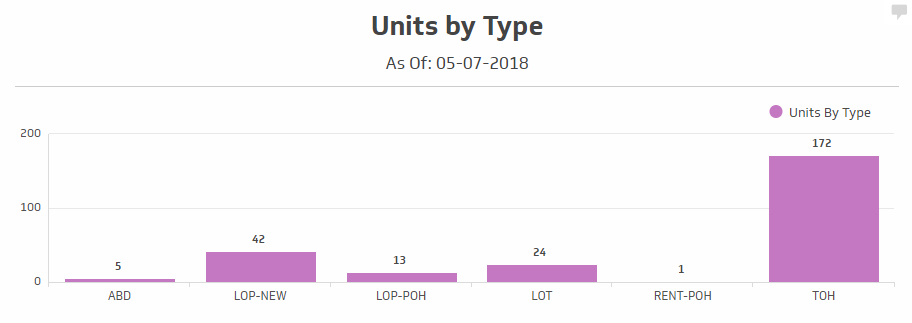
Description: Shows the number of units by unit type
Source: Rental Unit Listing
Notes:– Shows the counts as of the report run date
– Barchart
Dashboard Edition: Bronze, Silver or Custom
Component ID: LEAS-01
Source: Rental Unit Listing
Notes:– Shows the counts as of the report run date
– Barchart
Dashboard Edition: Bronze, Silver or Custom
Component ID: LEAS-01
Actual vs Budget NOI
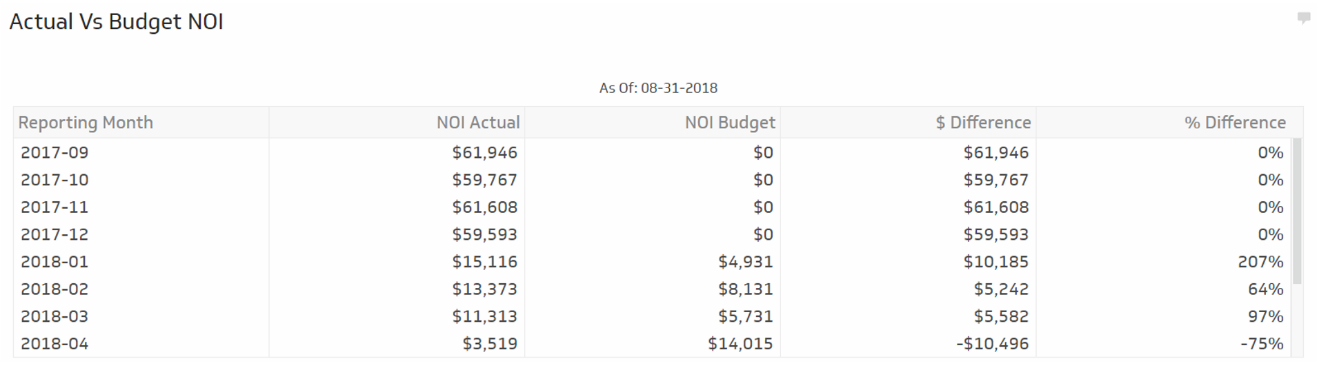
Description: Actual vs. Budget NOI for the 12 months
Source: Actual Budget Fiscal Year Analysis
Notes: -The numbers are displayed as a text table
-The $ and % difference are also displayed
Dashboard Edition: Bronze, Silver or Custom
Component ID: PL-01
Source: Actual Budget Fiscal Year Analysis
Notes: -The numbers are displayed as a text table
-The $ and % difference are also displayed
Dashboard Edition: Bronze, Silver or Custom
Component ID: PL-01
Billed Charges
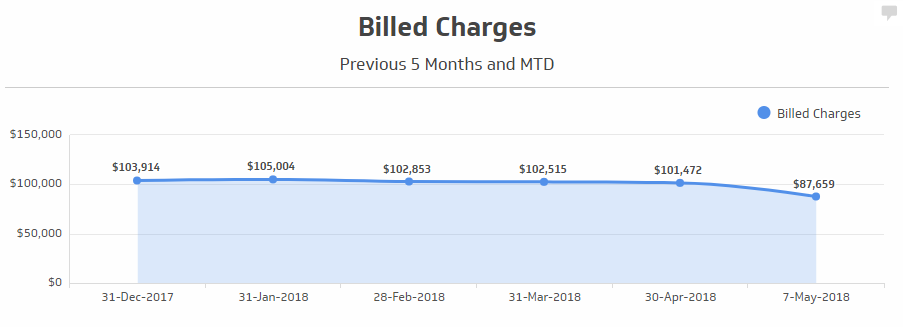
Description: Trend of Billed Charges
Source: Charge Detail Report
Notes: Previous 5 month and Month to Date
Dashboard Edition: Bronze, Silver or Custom
Component ID: COLL-01
Source: Charge Detail Report
Notes: Previous 5 month and Month to Date
Dashboard Edition: Bronze, Silver or Custom
Component ID: COLL-01
Receipts
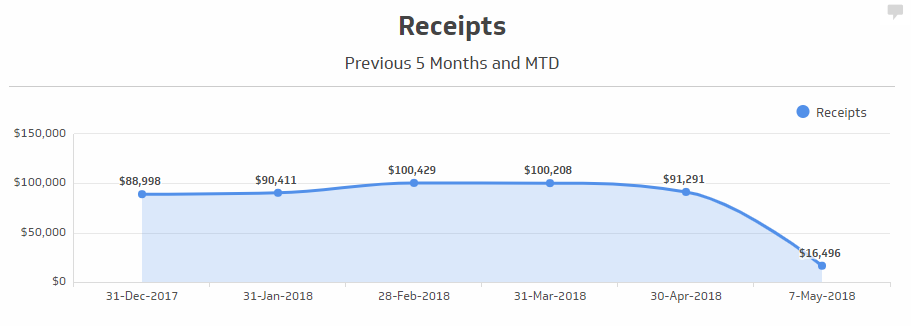
Description: Trend of Total Receipts
Source: All Receipts Deposited
Notes: Previous 5 months and Month to Date
Dashboard Edition: Bronze, Silver or Custom
Component ID: COLL-02
Source: All Receipts Deposited
Notes: Previous 5 months and Month to Date
Dashboard Edition: Bronze, Silver or Custom
Component ID: COLL-02
Vacant Home Status
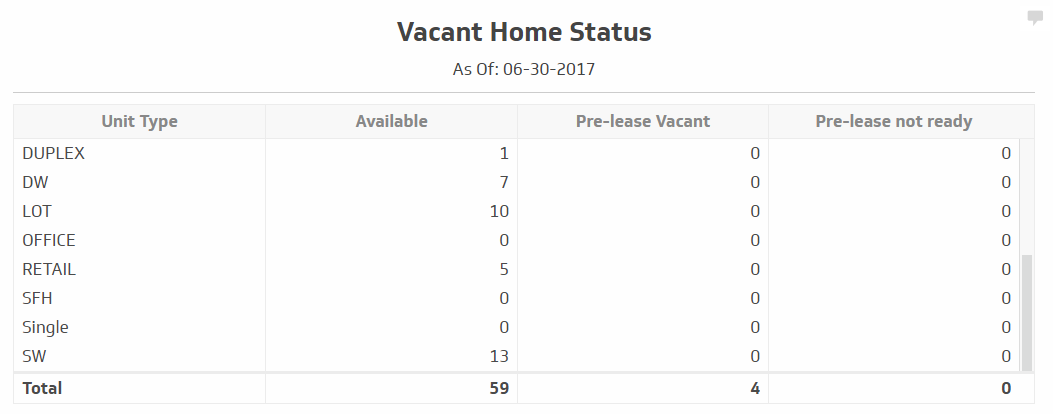
Description: Available, Vacant and Not-Ready units by Unit Type
Source: Unit Availability Listing Report
Notes: – Data is as of report run date
– Text table
Dashboard Edition: Bronze, Silver or Custom
Component ID: LEAS-03
Source: Unit Availability Listing Report
Notes: – Data is as of report run date
– Text table
Dashboard Edition: Bronze, Silver or Custom
Component ID: LEAS-03
Incomplete Leases
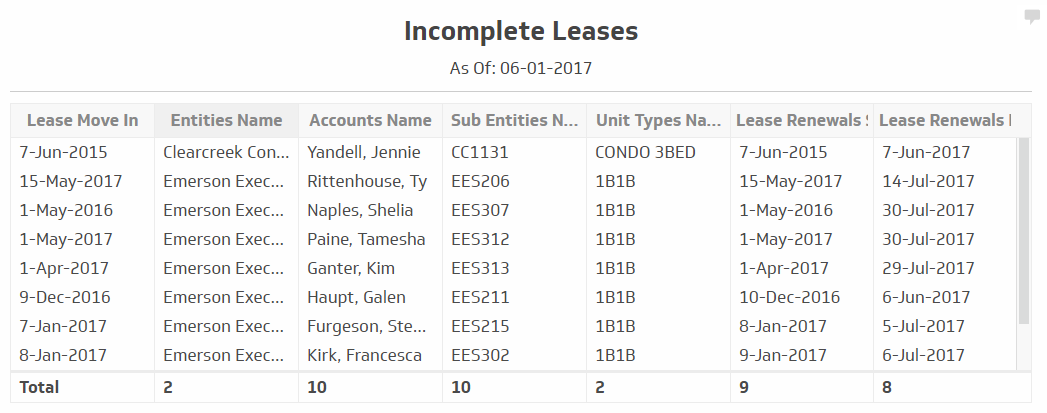
Description: Incomplete Leases by Entity, Account and Lease End Date
Source: Lease Expiration Report
Notes: Text table
Dashboard Edition: Bronze, Silver or Custom
Component ID: LEAS-04
Source: Lease Expiration Report
Notes: Text table
Dashboard Edition: Bronze, Silver or Custom
Component ID: LEAS-04
Leases Expiring Bar Chart
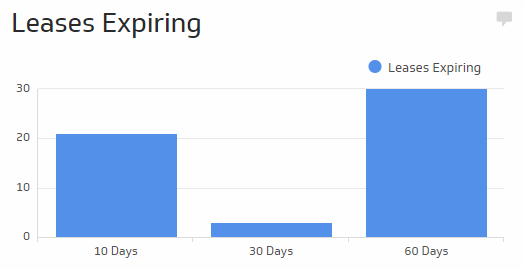
Description: Number of leases expiring in 10, 30 and 60 days
Source: Summary Rent Roll Report
Notes: – The counts are as of the report run date
– Bar chart
– Does not display by Unit Type (available in Custom Edition)
Dashboard Edition: Bronze, Silver or Custom
Component ID: LEAS-05
Source: Summary Rent Roll Report
Notes: – The counts are as of the report run date
– Bar chart
– Does not display by Unit Type (available in Custom Edition)
Dashboard Edition: Bronze, Silver or Custom
Component ID: LEAS-05
Leases Expiring Within 60 Day
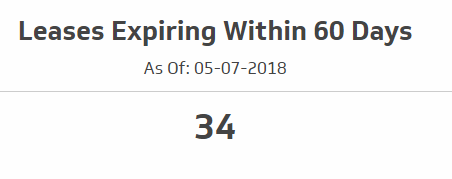
Description: Leases expiring within 60 days
Source: Lease Expiration Report
Notes: – Bold, text display of the number of leases expiring
– The count is as of the report run date
Dashboard Edition: Bronze, Silver or Custom
Component ID: LEAS-06
Source: Lease Expiration Report
Notes: – Bold, text display of the number of leases expiring
– The count is as of the report run date
Dashboard Edition: Bronze, Silver or Custom
Component ID: LEAS-06
Aged Receivables
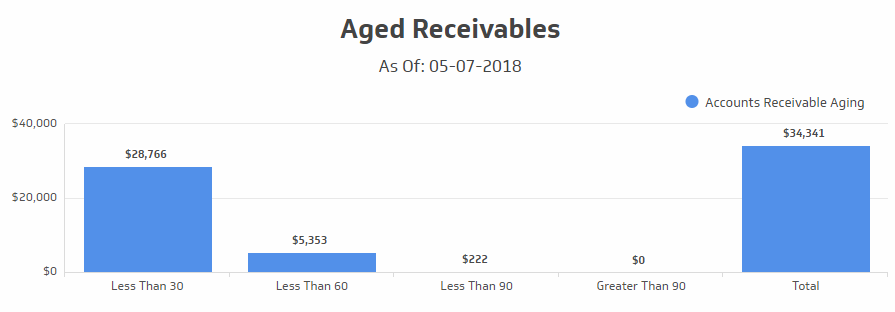
Description: Chart of Aged Receivables
Source: Aged Receivables Report
Notes: – The barchart shows the relative amounts by aging bucket
– The dollar amount in text is also displayed
– Amounts are as of the report run date
Dashboard Edition: Bronze, Silver or Custom
Component ID: COLL-03
Source: Aged Receivables Report
Notes: – The barchart shows the relative amounts by aging bucket
– The dollar amount in text is also displayed
– Amounts are as of the report run date
Dashboard Edition: Bronze, Silver or Custom
Component ID: COLL-03
Vacant Units
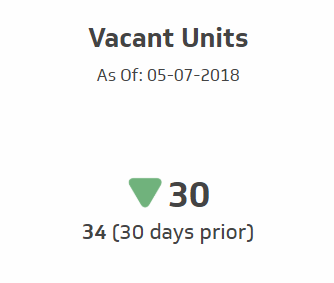
Description: Number of Vacant Units as well as change compared to 30 Days Prior
Source: Vacancy Report
Notes: Does not distinguish by Unit Type
Dashboard Edition: Silver or Custom
Component ID: LEAS-07
Source: Vacancy Report
Notes: Does not distinguish by Unit Type
Dashboard Edition: Silver or Custom
Component ID: LEAS-07
Occupied Units
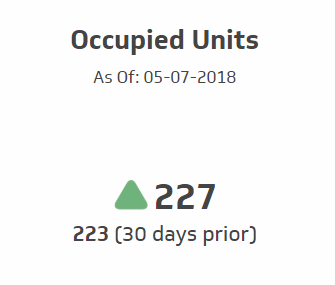
Description: Number of Occupied Units as well as change compared to 30 Days Prior
Source: Customer Listing Report
Notes: – Does not distinguish by Unit Type
Dashboard Edition: Silver or Custom
Component ID: LEAS-08
Source: Customer Listing Report
Notes: – Does not distinguish by Unit Type
Dashboard Edition: Silver or Custom
Component ID: LEAS-08
Occupancy Gauge
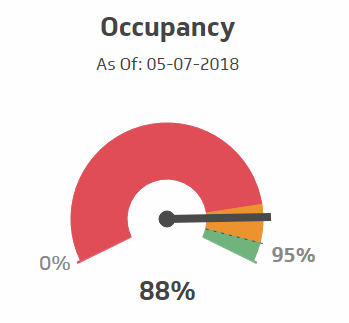
Description: Gauges shows the Occupancy % with respect to targets
Source: Customer Listing Report
Notes: Targets (Red / Orange / Green) ranges are maintained in an Excel file for each property group
Dashboard Edition: Custom
Component ID: LEAS-09
Source: Customer Listing Report
Notes: Targets (Red / Orange / Green) ranges are maintained in an Excel file for each property group
Dashboard Edition: Custom
Component ID: LEAS-09
Vacancy Gauge
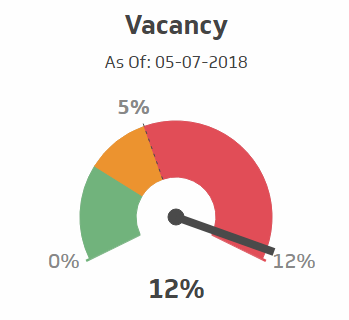
Description: Gauges shows the Vacancy % with respect to targets
Source: Vacancy Report
Notes: – Targets (Red / Orange / Green) ranges are maintained in an Excel file for each property group
Dashboard Edition:Custom
Component ID: LEAS-10
Source: Vacancy Report
Notes: – Targets (Red / Orange / Green) ranges are maintained in an Excel file for each property group
Dashboard Edition:Custom
Component ID: LEAS-10
Delinquent Amount
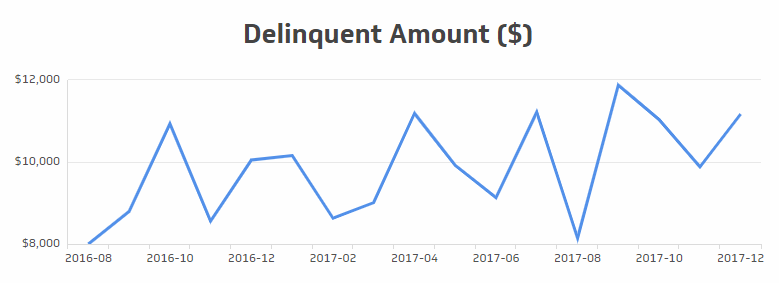
Description: Displays the Delinquent Amount at the end of each month
Source: Delinquency Report
Notes: – Line chart
– Previous 11 months and Month-to-Date
Dashboard Edition: Bronze, Silver, Custom
Component ID: COLL-04
Source: Delinquency Report
Notes: – Line chart
– Previous 11 months and Month-to-Date
Dashboard Edition: Bronze, Silver, Custom
Component ID: COLL-04
A/R Aging Donut Chart
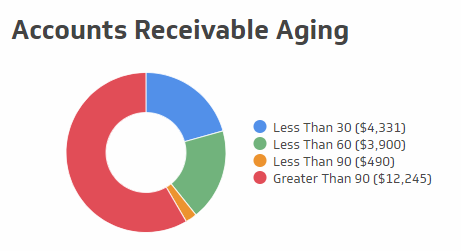
Description: Displays the relative amount of receivables in 4 aging buckets
Source: Aged Receivables Report
Notes: – Donut Chart
Source: Aged Receivables Report
Notes: – Donut Chart
– Data is as of report run date
Dashboard Edition:Bronze, Silver, Custom
Component ID: COLL-05
Rent Loss Due to Vacancy
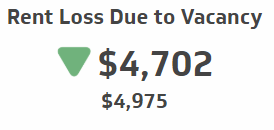
Description: Displays Rent Loss for current month and previous month
Source: Summary Rent Roll Report
Notes: – Up/Down indicator displays increase or decrease over prior month (in Red/Green color)
– Previous 11 months and Month-to-Date
Dashboard Edition: Bronze, Silver, Custom
Component ID: LEAS-13
Source: Summary Rent Roll Report
Notes: – Up/Down indicator displays increase or decrease over prior month (in Red/Green color)
– Previous 11 months and Month-to-Date
Dashboard Edition: Bronze, Silver, Custom
Component ID: LEAS-13
Expense Gauge
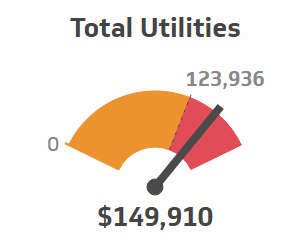
Description: Displays the Month to Date Expense and above/below target status for selected GL Expense accounts
Source: Actual Budget Fiscal Year Analysis Report
Notes: -Available for any Expense GL Account
Source: Actual Budget Fiscal Year Analysis Report
Notes: -Available for any Expense GL Account
– Cutoff between Orange and Red is the Budget amount
Dashboard Edition:Custom
Component ID: PL-02
Vacancies at Month End
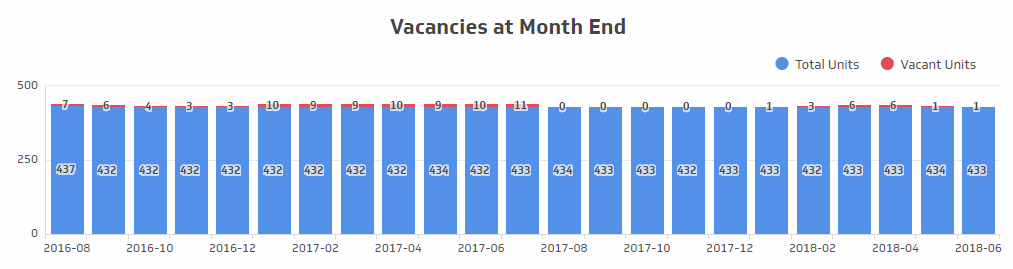
Description: Displays Total Units and Vacant Units in stacked bar chart
Source: Summary Rent Roll Report
Notes: – Displays both Vacant Units and Total Units at Month End
Dashboard Edition: Bronze, Silver, Custom
Component ID: LEAS-11
Source: Summary Rent Roll Report
Notes: – Displays both Vacant Units and Total Units at Month End
Dashboard Edition: Bronze, Silver, Custom
Component ID: LEAS-11
Total Income Gauge
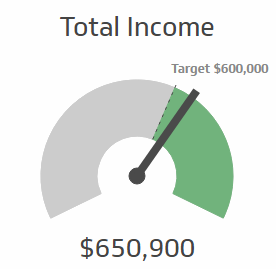
Description: – Displays the Month to Date amount
– Can display any line from the Budget Comparison report
Source: Actual Budget Fiscal Year Analysis Report
Notes: – Target on the gauge is the budget amount in Rent Manager
– Actual amount is as of report run date
Dashboard Edition:Bronze, Silver, Custom
Component ID: PL-05
– Can display any line from the Budget Comparison report
Source: Actual Budget Fiscal Year Analysis Report
Notes: – Target on the gauge is the budget amount in Rent Manager
– Actual amount is as of report run date
Dashboard Edition:Bronze, Silver, Custom
Component ID: PL-05
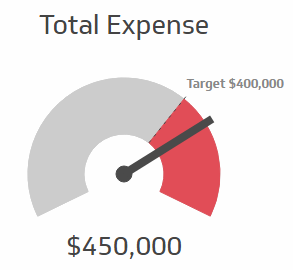
Total Expense Gauge
Description: Displays the Month to Date amount
– Can display any line from the Budget Comparison report
Source: Actual Budget Fiscal Year Analysis Report
Notes: – Target on the gauge is the budget amount in Rent Manager
– Actual amount is as of report run date
Dashboard Edition: Bronze, Silver, Custom
Component ID: PL-10
– Can display any line from the Budget Comparison report
Source: Actual Budget Fiscal Year Analysis Report
Notes: – Target on the gauge is the budget amount in Rent Manager
– Actual amount is as of report run date
Dashboard Edition: Bronze, Silver, Custom
Component ID: PL-10
NOI Gauge
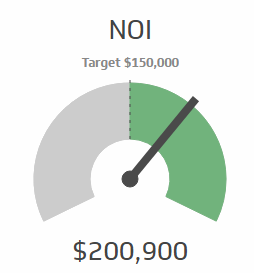
Description: – Displays the Month to Date amount
– Grey/Green cutoff is the Budgeted NOI
Source: Actual Budget Fiscal Year Analysis Report
Notes: – Target on the gauge is the budget amount in Rent Manager
– Actual amount is as of report run date
Dashboard Edition:Silver, Custom
Component ID: PL-11
– Grey/Green cutoff is the Budgeted NOI
Source: Actual Budget Fiscal Year Analysis Report
Notes: – Target on the gauge is the budget amount in Rent Manager
– Actual amount is as of report run date
Dashboard Edition:Silver, Custom
Component ID: PL-11
Gauge and Sparkline for NOI
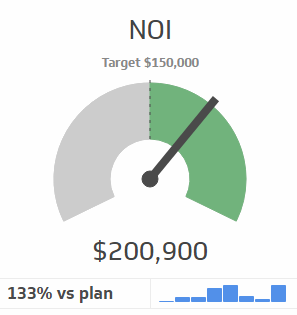
Description: Displays the Month to Date amount as well as the 12-month sparkline
– Can display any line from the Budget Comparison report
Source: Budget Comparison Report (for gauge)
– P&L Report (for 12 month sparkline)
Notes: – Target on the gauge is the budget amount in Rent Manager
Dashboard Edition:Custom
Component ID: PL-07
– Can display any line from the Budget Comparison report
Source: Budget Comparison Report (for gauge)
– P&L Report (for 12 month sparkline)
Notes: – Target on the gauge is the budget amount in Rent Manager
Dashboard Edition:Custom
Component ID: PL-07
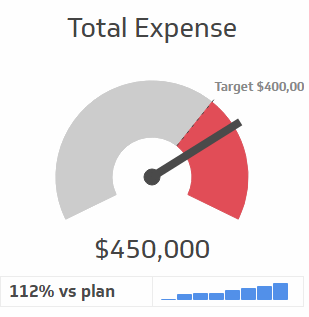
Gauge and Sparkline for Total Expense
Description: – Displays the Month to Date amount as well as the 12-month sparkline
– Can display any line from the Budget Comparison report
Source: – Budget Comparison Report (for gauge)
P&L Report (for 12 month sparkline)
Notes: – Target on the gauge is the budget amount in Rent Manager
Dashboard Edition:Custom
Component ID: PL-08
– Can display any line from the Budget Comparison report
Source: – Budget Comparison Report (for gauge)
P&L Report (for 12 month sparkline)
Notes: – Target on the gauge is the budget amount in Rent Manager
Dashboard Edition:Custom
Component ID: PL-08
Gauge and Sparkline for Total Income
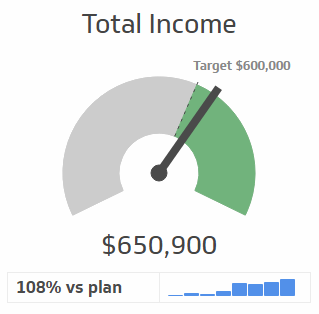
Description: – Displays the Month to Date amount as well as the 12-month sparkline
– Can display any line from the Budget Comparison report
Source: Budget Comparison Report (for gauge)
– P&L Report (for 12 month sparkline)
Notes: – Target on the gauge is the budget amount in Rent Manager
Dashboard Edition:Custom
Component ID: PL-09
– Can display any line from the Budget Comparison report
Source: Budget Comparison Report (for gauge)
– P&L Report (for 12 month sparkline)
Notes: – Target on the gauge is the budget amount in Rent Manager
Dashboard Edition:Custom
Component ID: PL-09
Gauge and Sparkline for Vacancy Loss
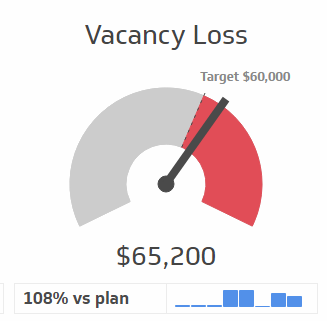
Description: – Displays the Month to Date amount as well as the 12-month sparkline
– Can display any line from the Budget Comparison report
Source: – Budget Comparison Report (for gauge)
P&L Report (for 12 month sparkline)
– Targets for Vacancy Loss to be stored in Excel
Notes: – Target on the gauge to be stored in Excel
Dashboard Edition:Custom
Component ID: LEAS-12
– Can display any line from the Budget Comparison report
Source: – Budget Comparison Report (for gauge)
P&L Report (for 12 month sparkline)
– Targets for Vacancy Loss to be stored in Excel
Notes: – Target on the gauge to be stored in Excel
Dashboard Edition:Custom
Component ID: LEAS-12
Combo for Multiple Metrics (Actual / Plan, Change and Trend)
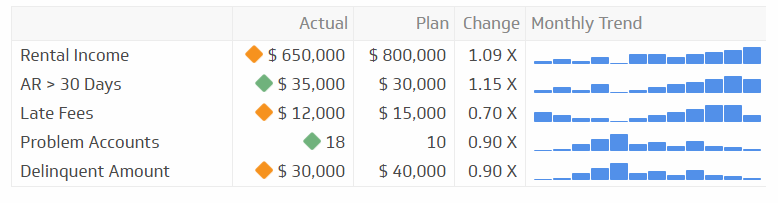
Description: – This is our premium display format for selected metrics
– Five types information are displayed for a metric (MTD Actual, MTD Plan, Above/Below Plan Indicator, Change vs Previous Month, 12 Month Trend)
Source: – For financial metrics: Budget Comparison Report (Actual, Target)
– For non-financial metrics:
* Actuals and Trend are from Relevant Rent Manager Report
* Plan values are from an Excel file or a User Defined Field (UDF)
Notes: – We display metrics in this format in our “Operations Meeting” dashboard
Dashboard Edition:Custom
Component ID: COMBO-01
Service Tickets
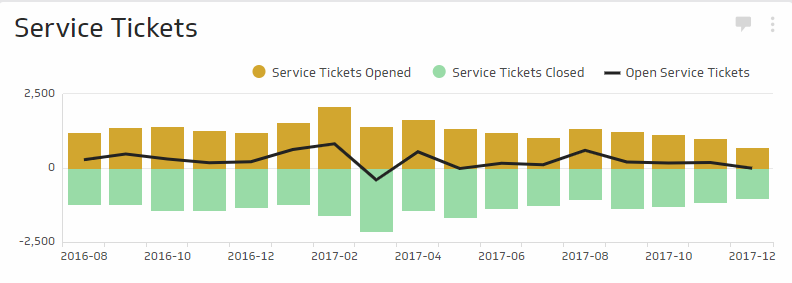
Description: – Service Tickets Opened, Tickets Closed and Tickets in Open Status
Source: Service Tickets Report
Notes:
Dashboard Edition:Bronze, Silver, Custom
Component ID: CARE-01
Source: Service Tickets Report
Notes:
Dashboard Edition:Bronze, Silver, Custom
Component ID: CARE-01
Leasing Activity
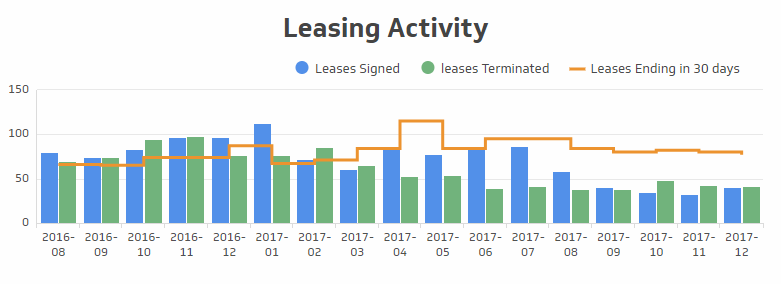
Description: – New Leases, Leases Terminated, Leases Ending in 30 Days
Source: TBD
Notes:
Dashboard Edition:Custom
Component ID: LEAS-12
Source: TBD
Notes:
Dashboard Edition:Custom
Component ID: LEAS-12
Ready to order your dashboard?