DOWNLOAD
Property Comparison Questionnaire
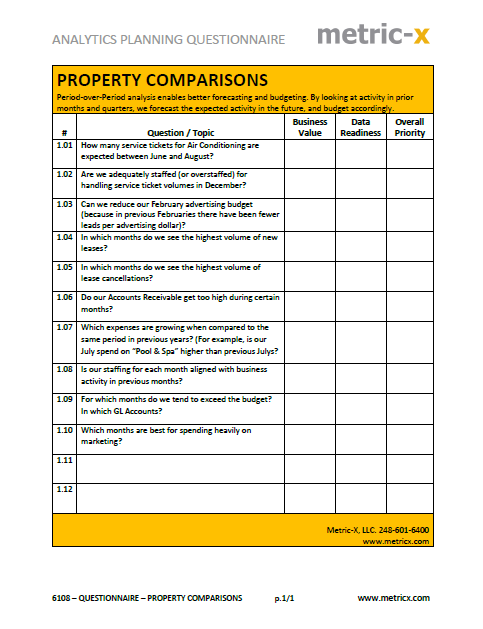
Which properties are performing better than others?
Use this questionnaire to decide what comparisons to perform …
- Do we have a consistent data structure so that we can compare property expenses, leases, income streams?
- Are each of our properties / regions using the same chart of accounts?
- Are transactions being charged to the correct GL account?
The questionnaire will help determine readiness to conduct property comparisons and prioritize the areas to focus on.
PROPERTY COMPARISIONS
Which properties are the benchmark for the rest in your portfolio?
What
- In order to apply best practices across your portfolio, compare the performance of similar properties
- Compare the performance of property groups with other property groups
- Use common metrics for each property group
- Have the “one-click” ability to include / exclude some properties from reports and ratios to understand their cumulative impact
Benefits
- Understand which properties are being run more efficiently
- Replicate what’s working in one property group to the rest of your properties
- Evaluate the performance of managers and give them more accurate performance feedback
Challenges
- Reports in most property management systems are too rigid for ad-hoc analysis of the data
- Inconsistent use of the chart of accounts (for example, one property team records Electricity, Water, Gas in three separate GL accounts, while another team records them in a single GL account “Utilities”)
- Lack of tools for ad-hoc data analysis (Excel’s pivot tables are useful for ad-hoc analysis, but you will need a tool like Tableau or Power BI for more flexible, powerful analysis)
- Many transactions are not recorded at the property level
- Data needs to be cleaned up before analysis can be done
Solutions
- Metric-X’s solutions include extracting data for the required properties and then combining the data in a database
- We also pull in data from additional sources, such as Google Analytics, your CRM system, your service ticketing system, General Ledger etc.
- We create additional columns for property groups, property types, operations start date, property manager etc.
- Using a tool like Excel or Tableau, we perform comparisons and answer your questions
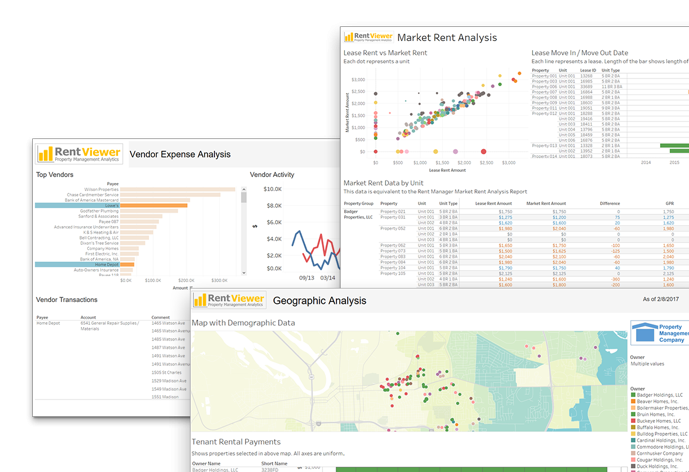
RentViewer
Our solutions are built on the RentViewer software. RentViewer connects to data sources (such as Property Management Systems, other systems and Excel files), collates the data and enables the creation of Executive Dashboards, Custom Reports and Analytical Solutions
Do you have questions and need detailed explanation of how our product could help your businness?
Schedule a free consultation
The Property Management Metrics Handbook
Which property management metrics are important to you?
See a list of over 100 metrics for categories such as:
- Lead Management Metrics
- Lease Application Metrics
- Unit Turnover Metrics
Use the Handbook for ideas on metrics that will be useful to your company.
Decide which property management metrics should be tracked and used for setting improvement goals.